TLDR
- Ethereum has bounced back from a low of $2,120, with signs of upward momentum above $2,650
- Price is currently challenged by resistance near $2,840 and the 100-hourly Simple Moving Average
- ETH witnessed a major 30% plunge, swiftly recovering after news about U.S. trade discussions
- A pivotal support level on the ETH/BTC chart at 0.028 could spark a dramatic upward move
- Technical indicators reveal ETH maintaining its stance above essential moving averages at $2,482 and $2,288
Ethereum (ETH) has clawed back after testing lower supportive levels, with the number-two cryptocurrency by market cap exceeding the $2,650 threshold in recent trades.
The digital coin has proven its resilience amid a turbulent market that witnessed a price drop to $2,120.
The rebound phase initiated when Ethereum garnered strong buying interest near the $2,120 support zone. Market insights indicate buyers were aggressive at these points, propelling the price past several critical resistance thresholds.
The upward trend gathered steam as ETH successfully surpassed both the $2,550 and $2,650 resistance marks.
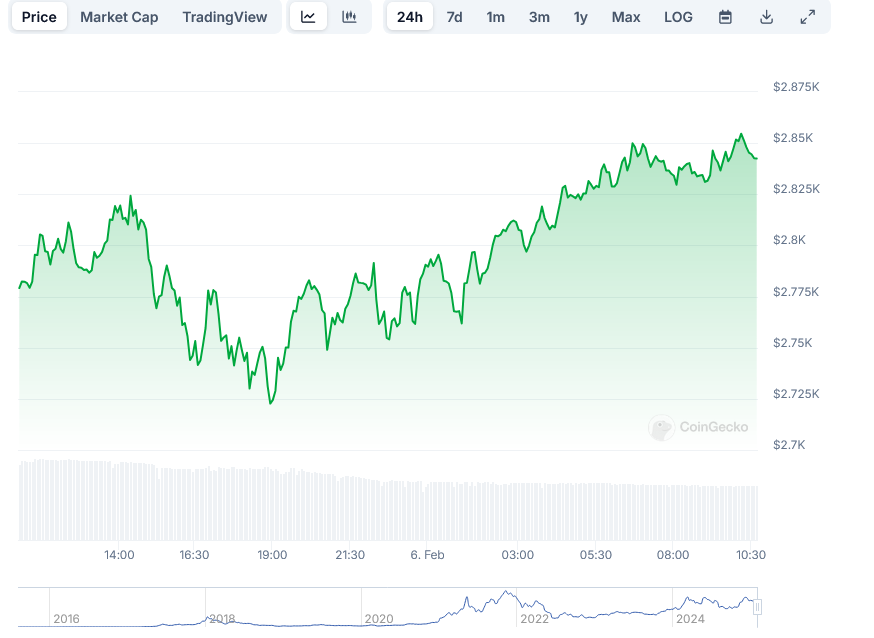
ETH Price
Technical analysis discloses that Ethereum’s price dynamics involved breaking past a short-term descending channel, with a previous resistance level set at $2,780. This technical leap is regarded positively by market players, hinting at potential further upside movements.
The recent price trajectory of this cryptocurrency unfolds amid broader market patterns, including a striking session that saw ETH tumble over 30% within a day. This rapid fall was linked to tension around U.S. trade wars, but markets steadied promptly following announcements about negotiations with Canada and Mexico.
Current market structures show Ethereum trading beneath the $2,850 level and the 100-hourly Simple Moving Average, pointing out that while recovery is ongoing, certain technical challenges persist. The $2,840 level has emerged as a focal point, functioning as immediate resistance along with the moving average.
Looking at the wider technical scenario, Ethereum’s price has retraced approximately 50% of the decline from the $3,400 peak to the recent $2,120 low. Traders are closely observing this retracement level as a potential gauge of the recovery's power.
Currently, the market confronts a significant resistance cluster near the $2,920 mark, aligning with the 61.8% Fibonacci retracement of the recent drop. An effective breach above this zone could pave the way to the psychologically significant $3,000 mark.
On the ETH/BTC chart, experts have pinpointed a vital horizontal support at around 0.028. This technical juncture is under close scrutiny by market watchers as a possible launching pad for more robust price movements, should buying sentiment intensify.
The cryptocurrency has held its ground above two vital moving averages – the 200-day average at $2,482 and the 200-day exponential average at $2,288. Historically, these levels have acted as key support zones since July 2020, indicating the long-term upward trend remains firm despite recent fluctuations.
Trading patterns denote healthy market engagement during the recovery period, though some traders maintain a cautious stance given the recent market swings. The hourly MACD has shown increasing momentum in the bullish range, while the RSI has climbed past 50, suggesting rising buying interest.
Established support has formed at $2,700 and $2,640, with these regions likely to be tested should the ongoing recovery meet resistance. Additional support can be observed at $2,550, potentially acting as a cushion should selling pressure intensify.
Recent data highlights that the crypto arena has undergone one of its biggest liquidation events, wiping over $8 billion from the market between Sunday night and Monday. Ethereum was notably impacted during this window, heightening examination of its price actions compared to other digital assets.
For traders zeroed in on immediate price action, the $2,800 level has surfaced as a critical point that bulls need to reclaim and sustain as a support. This price level is both a psychological and technical hurdle that could indicate renewed market vigor if effectively surpassed.