Candlestick crypto charts are compact yet rich with insights into coin price movements over specific periods.
While the intricate details of daily fluctuations can obscure the broader trend, moving averages offer a straightforward means to gauge a cryptocurrency's price direction over time.

Simple Moving Averages
The simplest form of moving averages is the simple moving average, calculated by averaging the closing prices over a certain period, like 30 days, akin to finding a mathematical mean.
Typically, you’ll encounter 50-, 100-, and 200-day simple moving averages. Though their calculations differ, they all generally reveal the momentum behind a cryptocurrency’s price. However, the equal weight assigned to all data points in a simple moving average can lead to biases caused by outliers.
The 50-Day Moving Average
The 50-day moving average serves as a short-term gauge of market sentiment. Prices surpassing this line on candlestick charts suggest robust market confidence, while intersections with longer-term lines can signal significant trends.
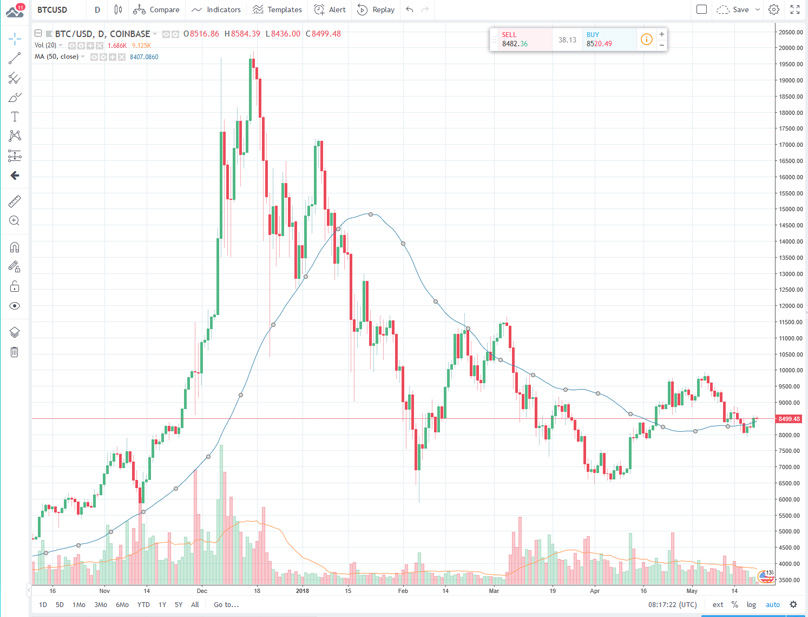
50 Day Moving Average illustrating BTC / USD, Image from Trading View
Interestingly enough, the 50-day moving average can indicate large institutional activities. Sharp movements below this line could signal underlying large-scale sell-offs.
The 100-Day Moving Average
The 100-day moving average offers insights into medium-term momentum, complementing the 50- and 200-day averages, primarily to identify intermediate trends.
Intermediate trends, part of the primary trends seen in a 50-day average, often reflect sharp market shifts driven by economic or political influences, running counter to the primary trajectory.
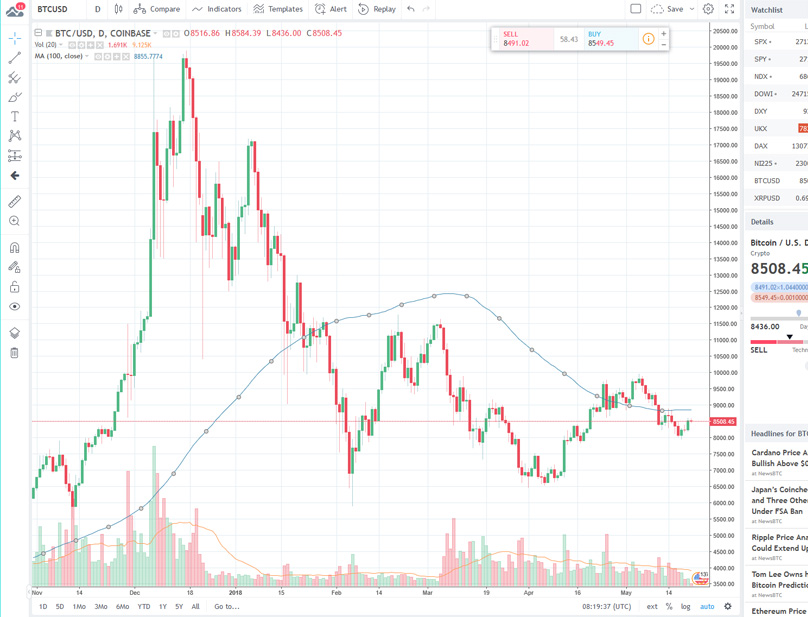
100 Day Moving Average illustrating BTC / USD, Image from Trading View
Both bullish and bearish cycles undergo roughly three intermediate phases spanning weeks. Prices above the 100-day average suggest positive momentum, while those below hint at negative trends.
The 200-Day Moving Average
The 200-day moving average reflects longer-term market movements, providing a broader outlook on a cryptocurrency's performance, essential for strategic decisions rather than day-to-day trading.
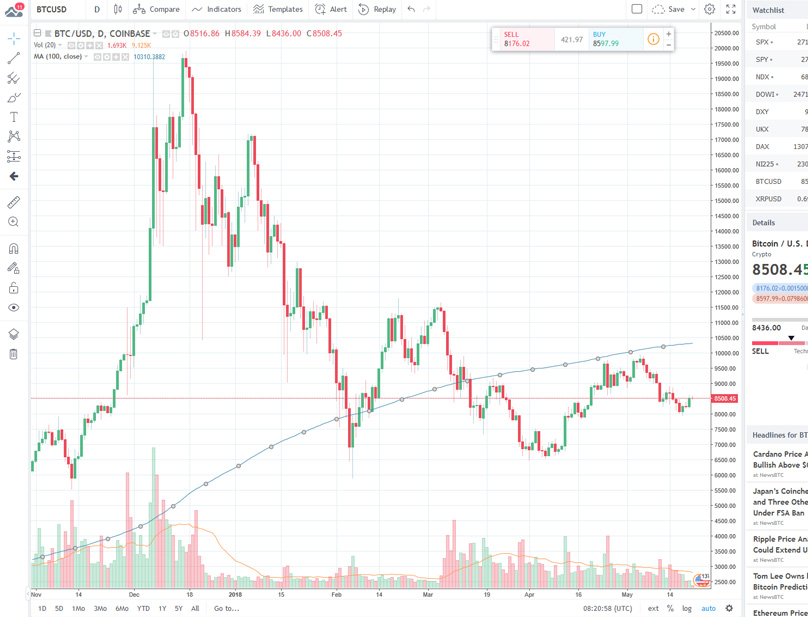
200 Day Moving Average illustrating BTC / USD, Image from Trading View
Despite the cryptocurrency market's notorious volatility, a consensus exists around an overarching positive trend, implying overall value growth.
Linear-Weighted Moving Averages
Linear-weighted moving averages add complexity by weighing each data point based on its sequential position within the series, giving more recent prices more influence.
Exponential Moving Averages
Exponential moving averages extend linear-weighted moving averages by incorporating an exponential factor, offering a smoothed view matching recent price movements more closely.
Using Moving Averages
Moving averages give valuable short-, medium-, and long-term insights into price trajectories. Prices above a moving average imply upward movement; below, a downward trend.
Crossing points between actual prices and moving averages lead to recognized bull or bear signals, like the golden or death cross, indicating significant price interactions.
Starting with moving averages in technical analysis offers foundational price trajectory insights, but it’s crucial to corroborate findings using complementary tools, ensuring a comprehensive analysis.
References
- https://cryptocurrencyhaus.com/crypto-trading-how-to-use-simple-moving-averages/
- https://cryptovest.com/education/crypto-trading-tips-momentum-indicators-explained-moving-averages/
- https://www.investors.com/how-to-invest/investors-corner/50-day-moving-average/
- https://www.marketmemory.com/indicators/100-day-moving-average
- https://www.investopedia.com/articles/technical/03/060303.asp
- https://www.investopedia.com/university/dowtheory/dowtheory2.asp
- https://financial-dictionary.thefreedictionary.com/Long-Term+Trend
- https://www.investopedia.com/terms/g/goldencross.asp
- https://www.cnbc.com/2018/03/28/bitcoin-is-nearing-a-death-cross-on-the-charts-heres-what-it-means.html